Most Melbourne school excursions end the same way. The bus arrives back at school. Teachers gather their students. The day is over.
What Urban Quest does next is different from every other excursion provider in Melbourne: it sends the teacher a Performance Report.
Not a generic thank-you email. A detailed, data-driven document that shows exactly how every team performed — completion rates, finishing times, engagement levels, problem-solving scores, and how the school’s best team ranks against every other school group that has ever done Urban Quest.
It’s the only Melbourne school excursion that produces something teachers can take back to their principal, their curriculum coordinator, or their next planning meeting as evidence that the day produced measurable outcomes — not just good memories.
What the Performance Report Contains
The report is generated automatically from data the Urban Quest platform captures throughout the excursion. It covers every team that participated and produces results across five dimensions:
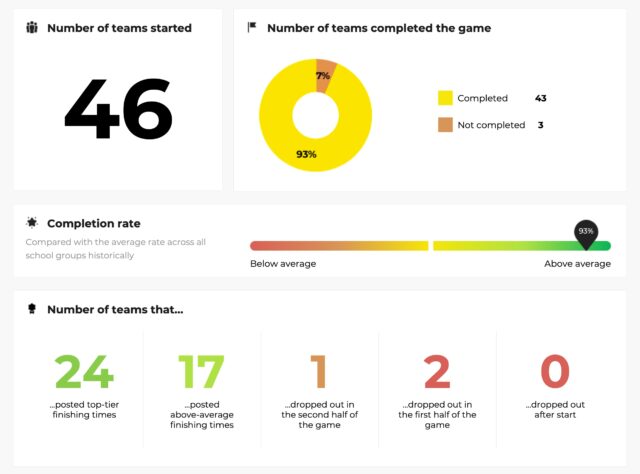
Completion rate — what percentage of teams completed the full experience, benchmarked against the average completion rate across all school groups historically. A school whose teams are performing above the historical average is seeing stronger-than-typical engagement.
Finishing time distribution — teams are categorised as top-tier finishers, above-average finishers, or teams that dropped out at different stages of the game. This gives teachers a picture of which teams stayed fully engaged throughout versus which ones lost momentum and where.
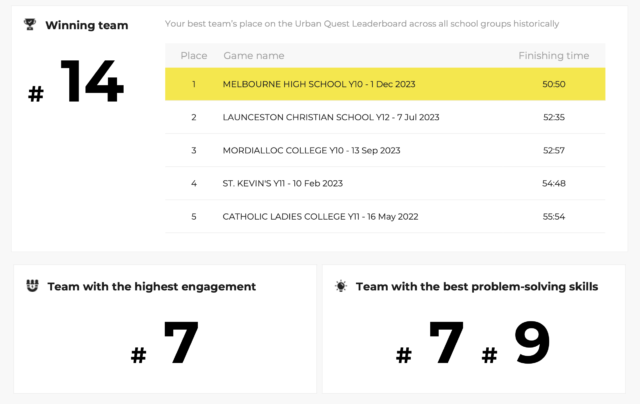
Winning team’s all-time leaderboard position — this is the element teachers find most surprising. Urban Quest maintains a cumulative leaderboard of every school group that has ever participated, tracked by finishing time. The report shows where the school’s best team ranks on that all-time leaderboard.
Team with the highest engagement — identified from platform data tracking how actively each team participated throughout the experience.
Team with the best problem-solving skills — identified from challenge completion patterns and hint usage across the game.
What a Real Performance Report Looks Like
Kilvington Grammar School’s Year 9 group ran their Urban Quest CBD excursion in March 2026. Their report shows:
14 teams started. 13 completed — a 93% completion rate, benchmarked as above average against all school groups historically.
3 teams posted top-tier finishing times. 7 teams posted above-average finishing times. 1 team dropped out in the second half. 0 teams dropped out in the first half.

Their winning team — Team 8 — finished in 54 minutes and 42 seconds, placing 4th on the all-time Urban Quest school leaderboard out of 141 school groups tracked since 2019.
The top five on that leaderboard:
- Melbourne High School Y10 — 1 Dec 2023 — 50:50
- Launceston Christian School Y12 — 7 Jul 2023 — 52:35
- Mordialloc College Y10 — 13 Sep 2023 — 52:57
- Kilvington Grammar School Y9 — 20 Mar 2026 — 54:42
- St Kevin’s Y11 — 10 Feb 2023 — 54:48

That leaderboard context is something no other Melbourne school excursion can provide. Kilvington’s Year 9 students don’t just know they won their event — they know they’re the fourth fastest school group in Urban Quest history. That’s a different kind of achievement for students to carry back to school.
Why Teachers Ask for It When It Doesn’t Arrive
Urban Quest sends the Performance Report automatically after every excursion. On the occasions when a teacher hasn’t received it — usually a spam filter issue — the response is consistent: teachers follow up to request it.
That unprompted follow-up is the clearest possible signal of the report’s value. Teachers aren’t asking for it because they feel obliged to acknowledge the day. They’re asking for it because they want the data.
The reasons vary. Some teachers use it to identify students who may need additional support with group dynamics or resilience — the team that dropped out in the second half is often worth a quiet conversation. Some use it to share with parents as evidence of what the excursion produced beyond a nice day out. Some use it in their own professional documentation of student development outcomes.
Sergiy Zubaryev, founder of Urban Quest, described the thinking behind the report:
“We believe that team building should go beyond the fun at school excursions. Our Performance Report does just that — it gives teachers data they can actually use.”
What the Data Measures — and What It Doesn’t
The Performance Report measures what the Urban Quest platform can track: completion, timing, engagement signals, and problem-solving patterns. It doesn’t claim to measure personality, academic ability, or long-term development outcomes.
What it does produce — reliably and specifically — is a picture of how a group of students performed as teams under genuine collaborative pressure. That picture has more practical value for a teacher than a generic post-excursion survey, because it’s based on what students actually did rather than what they say they felt.
For schools that run Urban Quest annually, the report creates a year-on-year comparison point for the same year level. A school that brings its Year 9 cohort every year can track how this year’s group performed against last year’s — which is the kind of longitudinal evidence that makes team building defensible as a curriculum investment rather than a discretionary social activity.
The All-Time Leaderboard — What It Signals to Students
The leaderboard is the element students respond to most strongly. The knowledge that their result will be measured against every other school group in Urban Quest’s history — going back to 2019, across 141+ tracked groups — changes how students approach the experience.
It creates accountability that a standard excursion doesn’t have. Students aren’t just competing against the other teams in their school. They’re competing against Melbourne High School’s fastest-ever Year 10 cohort, against Launceston Christian’s record-holding Year 12 students, against every school that has run Urban Quest before them.
That context is what makes Urban Quest’s competitive format genuinely motivating for secondary students rather than superficially game-like. The leaderboard is real, cumulative, and permanent — a record that outlasts the excursion day itself.
View the Urban Quest school leaderboard →
Note: the leaderboard image on the school excursions page is updated manually and may not yet reflect the most recent results — including Kilvington Grammar School’s 4th place finish from March 2026. The Performance Report sent to each school always shows the accurate current leaderboard position at the time of their event.
How the Performance Report Supports Curriculum Outcomes
Urban Quest’s school excursions are aligned to the Victorian Curriculum’s Personal and Social Capability strand — specifically the Relationships and Diversity sub-strand covering teamwork, communication, and collaboration, and the Critical and Creative Thinking capability covering problem-solving and reflective thinking.
The Performance Report gives those curriculum alignments empirical support. A teacher who needs to justify the excursion as a curriculum activity has, in the report, specific evidence that students demonstrated problem-solving skills, engaged collaboratively under time pressure, and performed at a measurable level against a benchmarked standard.
That’s a different conversation with a principal than “the students had a great time.”
Frequently Asked Questions
Does every school receive a Performance Report after their Urban Quest excursion?
Yes — the report is generated automatically and sent to the booking teacher after every excursion. If you haven’t received yours, check your spam folder first, then contact Urban Quest directly, and we’ll resend it.
Can the report be shared with parents or included in student portfolios?
Yes. The report is a PDF document suitable for sharing. Several schools include it in student wellbeing documentation or share the leaderboard results with students and parents as an acknowledgement of the achievement.
How long does the leaderboard go back?
The leaderboard tracks all school groups from 2019 onwards — currently 141+ tracked groups across Victoria and beyond. It is updated after every excursion.
Is the report available for school incursions as well as excursions?
The Performance Report is currently available for CBD school excursions. Contact Urban Quest to discuss what data is available for on-campus incursion formats.
Can we see a sample report before booking?
Yes — contact Urban Quest, and we can share a sample report so you can see exactly what your school will receive after the excursion.
Explore Urban Quest’s school excursions →
Read about what secondary students actually experience →
Contact Urban Quest for a school excursion proposal →
Urban Quest has delivered school excursions for hundreds of Victorian schools including Kilvington Grammar School, Melbourne High School, St Kevin’s College, Mordialloc College, Emmaus College, Waverley Christian College, Nazareth College, Cranbourne East Secondary College, Blackburn High School, Williamstown, Baimbridge College, Point Cook College, and many more.